From reports to institutional intelligence.
Analytics that answer the questions a principal or academic head actually asks — Data → Insights → Understanding → Action across your entire ecosystem.
One platform. Six intelligent roles.
Every role gets a tailored dashboard, analytics, permissions, AI assistant, and workflow.
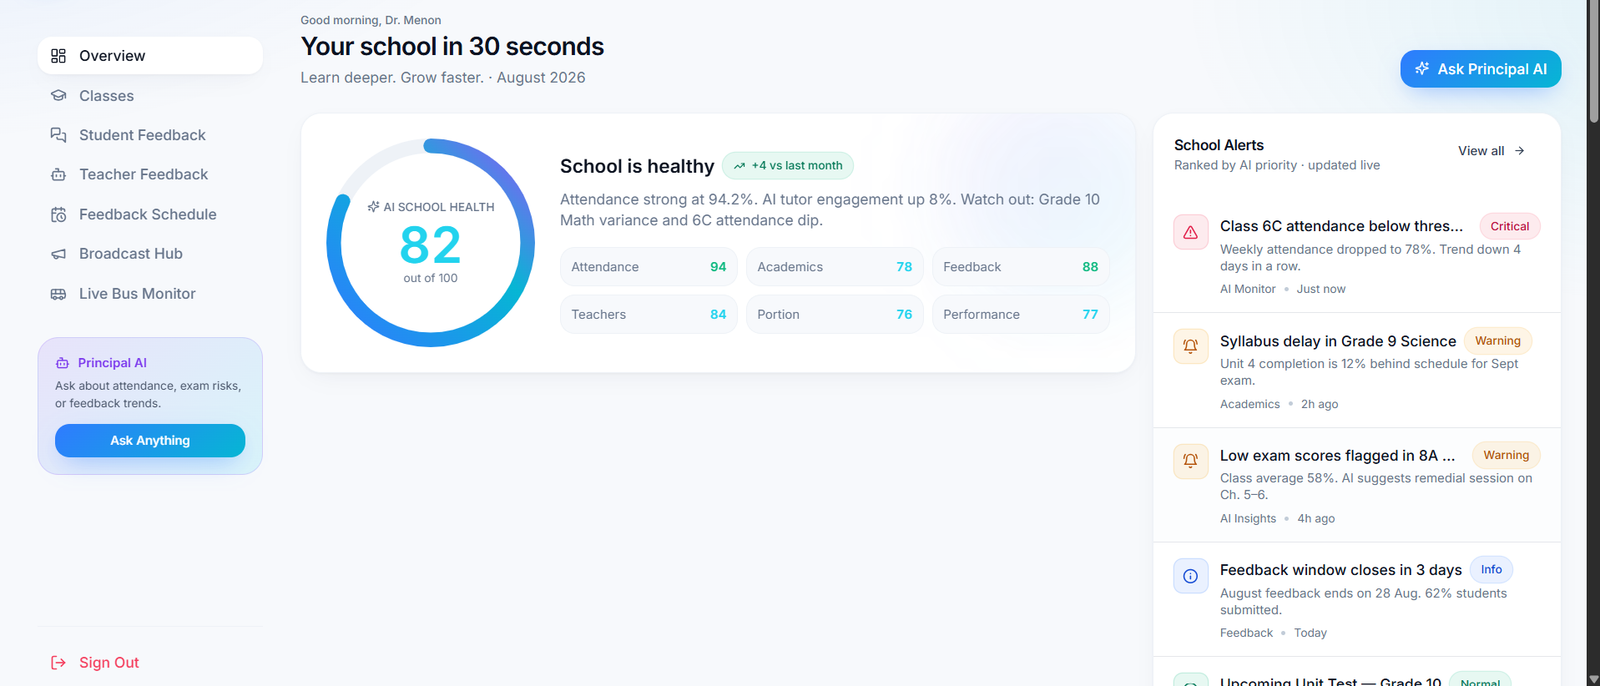
Principal Dashboard
Your school in 30 seconds — AI health, ranked alerts, Ask Principal AI.
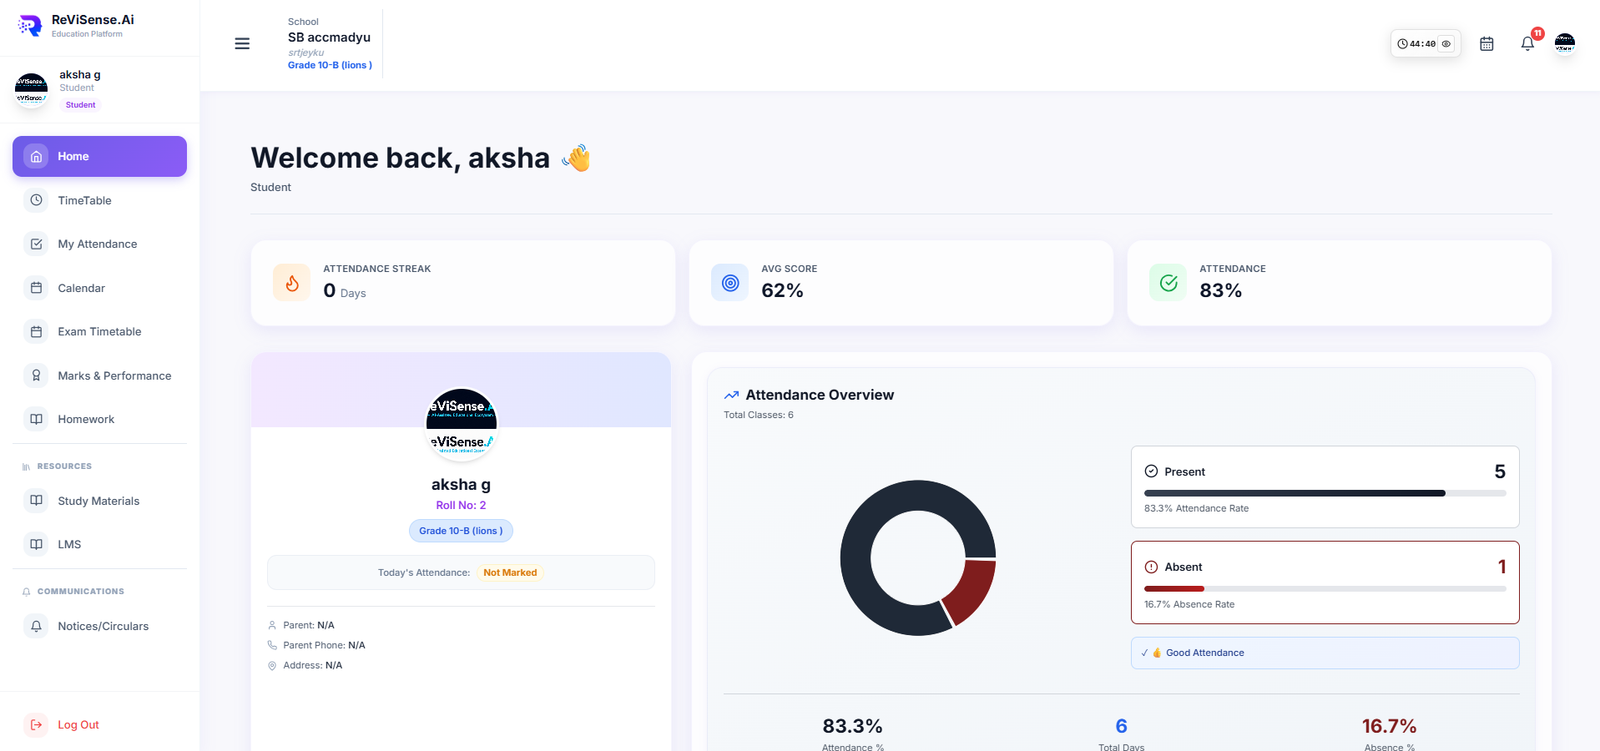
Student Dashboard
Personalised learning, AI tutor, and progress tracking.
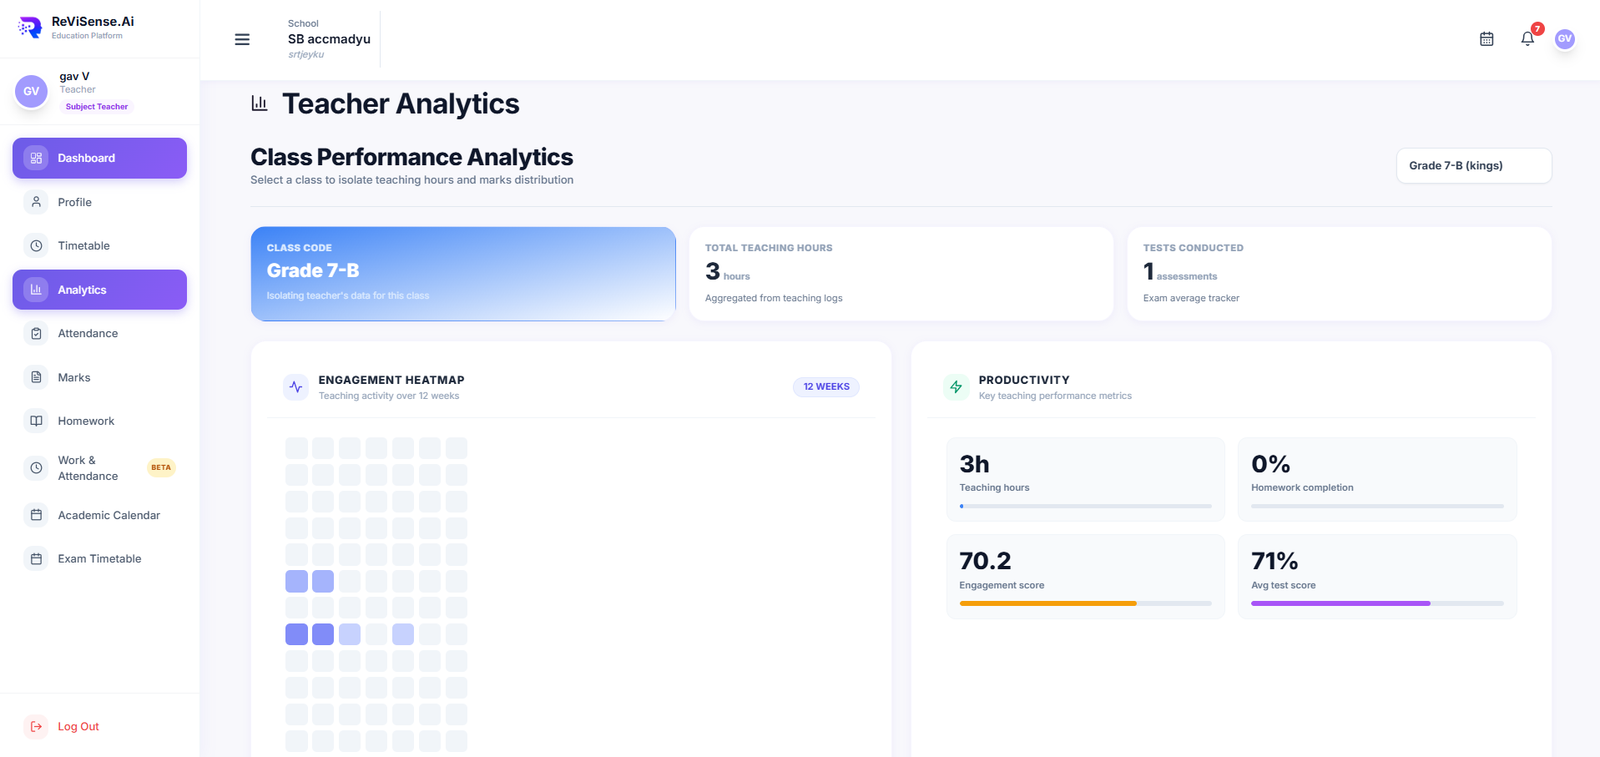
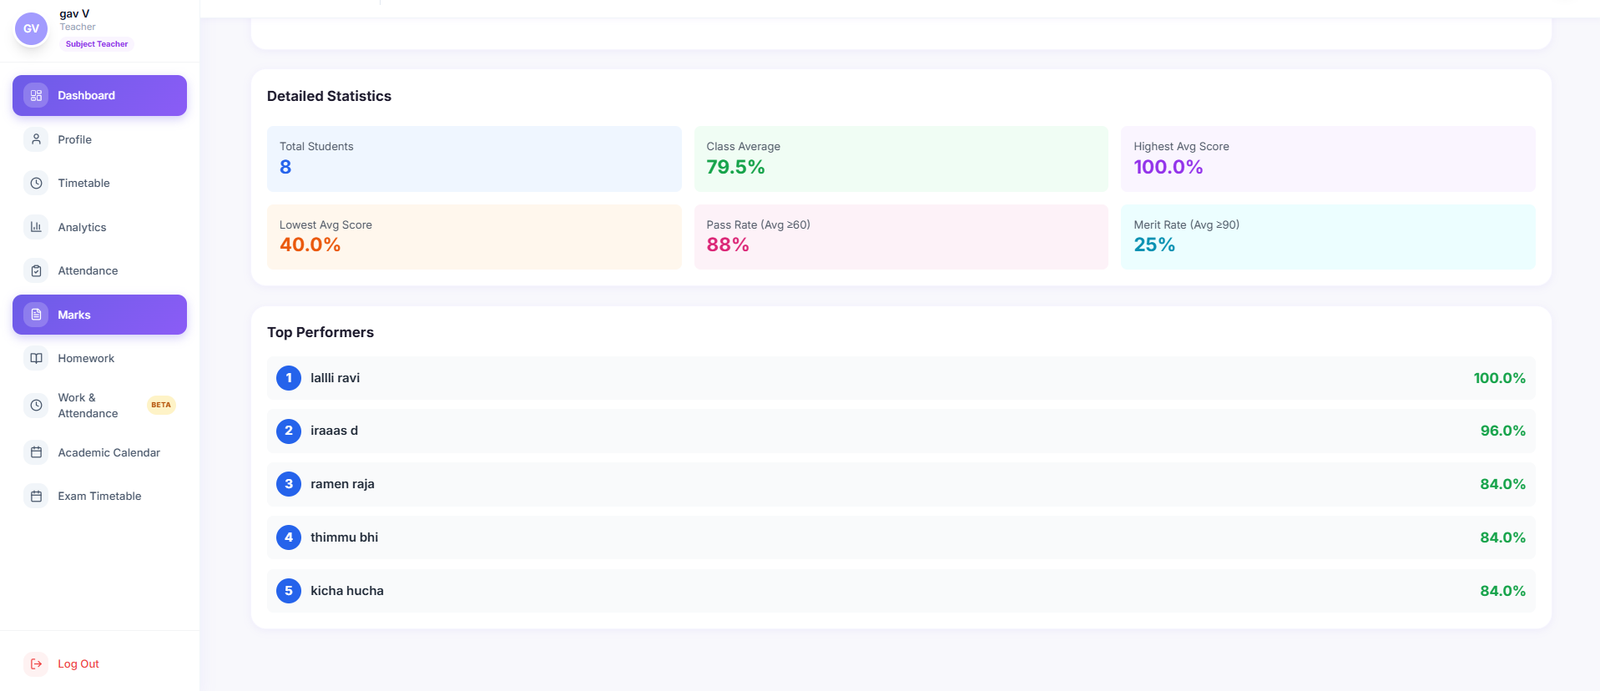
Teacher Dashboard
Class engagement, AI tools, and grading workflows.
Mentor Dashboard
Supervision analytics, approvals, and AI governance.
Parent Dashboard
Real-time visibility into attendance, results, and bus location.
Admin Dashboard
Institution-wide operations, control, and intelligence.
Educational intelligence, visualized.
Real-time analytics tailored to each role — student, teacher, mentor, and admin. Product preview panels with representative data.
Concept retention dropped below threshold — targeted revision suggested.
Consistent upward trajectory over the last 6 weeks.
Recommend diagram-led teaching for Algebra & Geometry.
Down 12% — review pacing and add interactive content.
Diagram-led delivery improves retention by ~21%.
Recognised for highest sustained engagement.
AI-validated, zero anomalies detected.
Behavioural pattern deviation — moderation queued.
Cohort on track to exceed term targets by 7%.
Driven by swipe attendance rollout across 36 classes.
Recommend Elite tier for 4 high-usage departments.
Cohorts projected to exceed goals by 7% — no intervention needed.
What can a principal actually know?
Analytics is only useful when it drives action. Here's what leadership can answer — instead of guessing.
Which classes need attention?
Cross-check attendance, mastery, revision completion and teacher activity.
Where is academic performance shifting?
Trend lines by class, subject, chapter and cohort.
Which subjects are drifting?
Compare across classes; spot the outliers early.
How are teachers using AI?
Adoption by department, popular workflows, teacher enablement gaps.
Which students need support?
Early-warning signals from attendance, engagement and mastery combined.
Is the institution improving?
Rolling term-over-term view of the KPIs leadership actually cares about.
The flow that turns numbers into next steps.
Analytics you can defend to your board.
Institution-owned
Your data. Your reports. Your decisions.
Role-scoped
Every view respects role-based access — no leakage across departments.
Transparent
Every metric is defined, sourced and reproducible — no black-box numbers.
Exportable
Standard exports for internal reports, board decks and academic reviews.
See analytics on your institution's data.
The best way to understand this layer is to see it on a shape you recognise. Book a walkthrough with our team.